All About EQ: Part 2
In Part 1 of this series, we covered the basics of how an EQ works and what it’s actually doing to your audio. In this installment of our series on EQ, we’re going to start to move towards putting the knowledge of frequencies into action.
If you read Part 1, you’ll remember that EQ is basically a fancy volume control, applied to only certain frequencies (or applied in different amounts to different frequencies). As you begin to think about using EQ in a music setting, you need to start thinking about where all the different sound sources sit in the frequency spectrum. So let’s start there.
The Frequency Range
Humans can hear frequencies ranging from roughly 20Hz (a flat E or sharp Eb three-and-a-half octaves below middle C) to 20kHz (a flat E or sharp Eb six-and-a-half octaves above middle C), although most human hearing starts to trail off in the upper range somewhere around 12kHz. Of course, not everyone hears as well as everyone else, and that changes over time. Typically, as we age or spend a lot of time exposed to loud sounds (power tools, jet engines, loud music, or drummers), our ears become less sensitive to higher frequencies.
The Ranges of Voices and Instruments
Not all of those frequencies are equally important to your job mixing audio. What matters there are the frequencies actually present in the music you’re working with, and knowing the basic range that various instruments span in the audio spectrum can speed up the process of dialing in a more musical set of EQs. This knowledge can help whether you need to boost the fundamental of a particular instrument or voice, to bring out another aspect of a source’s sound character, or to do a more surgical repair to the audio.
In the graphic below we’ve laid out the various ranges of the voices and instruments found in typical musical ensembles against a piano keyboard so that you can see how they overlap in both playing range and frequency content. (No disrespect to you clarinet, heckelphone, or marimba players out there; there’s just not enough space to list every instrument on this chart. Bari sax players, you guys rock, but you can just extrapolate from alto and tenor, right?) Note that this chart shows only the main range of these instruments: a trumpet, for instance, can be played much higher than shown here.
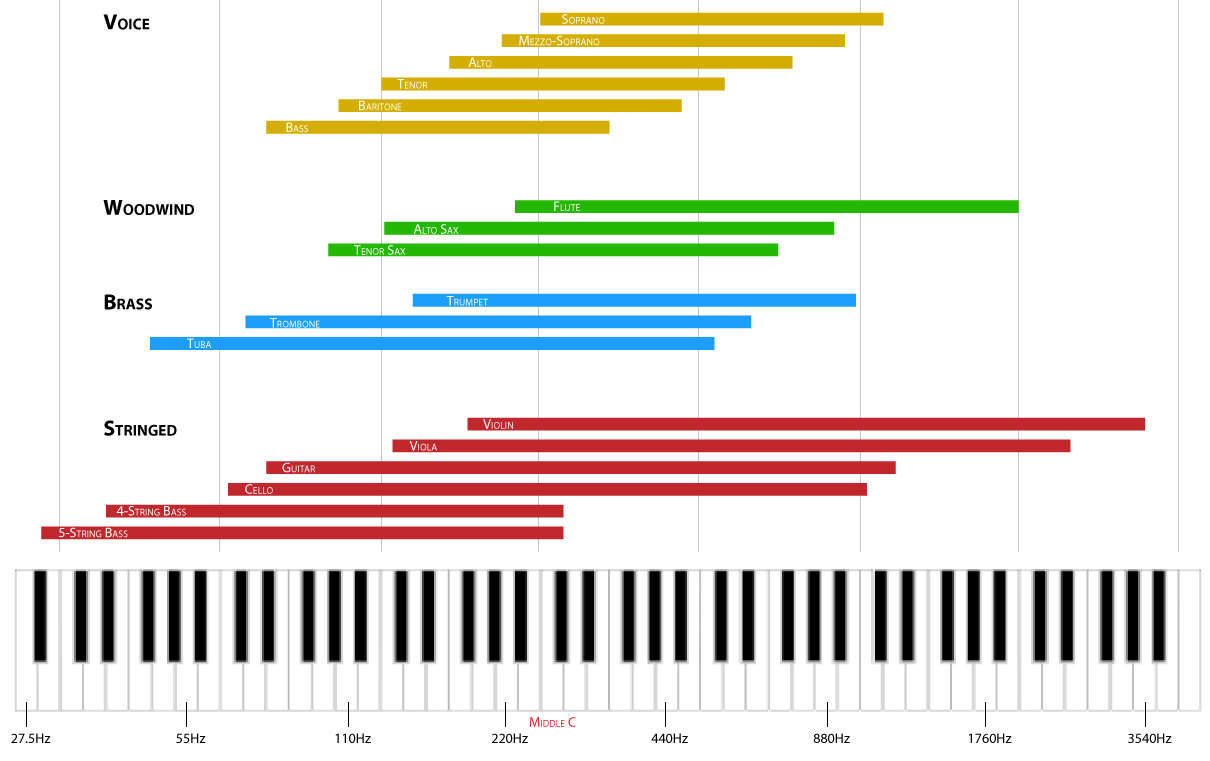
Frequency ranges of instruments as they relate to a piano keyboard and numerical frequencies.
Individual Channel or Whole Mix?
One thing that’s important to notice is that lots of instruments occupy the same frequency space. That’s not surprising, of course, but that highlights the importance of being mindful of what you’re EQing: an individual channel, a group/submix, or the whole mix. A good rule of thumb on that count is that EQ should be applied to individual channels as a way of shaping their tone, while EQ applied to the mix as a whole is more appropriate for balancing the frequency response of the speaker system and the ways the mix sits in the acoustics of the room you’re mixing in. The same principles apply in either case, but always remember to think about where you’re applying EQ and what will be affected by it.
Music in Action
As we’ve discussed, every instrument (even monophonic instruments like a voice, trumpet or drum) creates multiple frequencies at once because every note is comprised of its fundamental tone plus its harmonics/enharmonics. Having a sense of the interplay of those frequencies is really useful in figuring out how to effectively apply EQ to that instrument or voice.
Here we see a snapshot of audio on a spectrum analyzer graph that shows the amplitude (level) of all the frequencies being produced, with volume measured on the vertical axis and frequency along the horizontal axis. The solid blue area shows the level of each frequency at the point in time the image was captured, while the white dots on the graph indicate the minimum and maximum levels at those frequencies during the time window the analyzer was running.
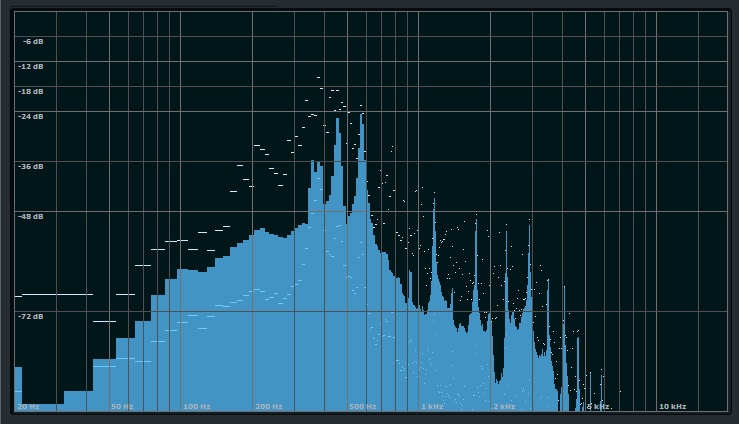
A snapshot of a spectrum analysis of an audio signal. The solid blue shows the level of each frequency at the exact point in time the image was captured, while the white dots show the highs and lows of each frequency during the time window used.
This graph shows that the loudest harmonic content of this audio sample falls in the 350-600Hz range, with clear harmonics above 1kHz and a steady fall below 100Hz. The best way to EQ this signal depends on what you’re trying to accomplish with EQ. If this was, for instance, an acoustic guitar, you might want to bring up the low end to make it sound fuller, while at the same time adding sparkle to the sound by boosting somewhere in the 5-8kHz range. If you wanted a flatter sound, you could cut in the 350-600Hz range where the most pronounced content is.
Tools to Help You See What You’re Hearing
Actually seeing the frequencies a given sound source is producing can be very helpful, particularly while you’re still developing your EQ chops. Fortunately, there are lots of spectrum analysis and real time audio analyzer (RTA) programs available for both iOS and Android smart phones and tablets, in addition, of course, to digital audio workstations (DAWs). Running a such a tool will give you quick visual insight into what’s going on with your audio, which may help you determine how to approach your EQ work.
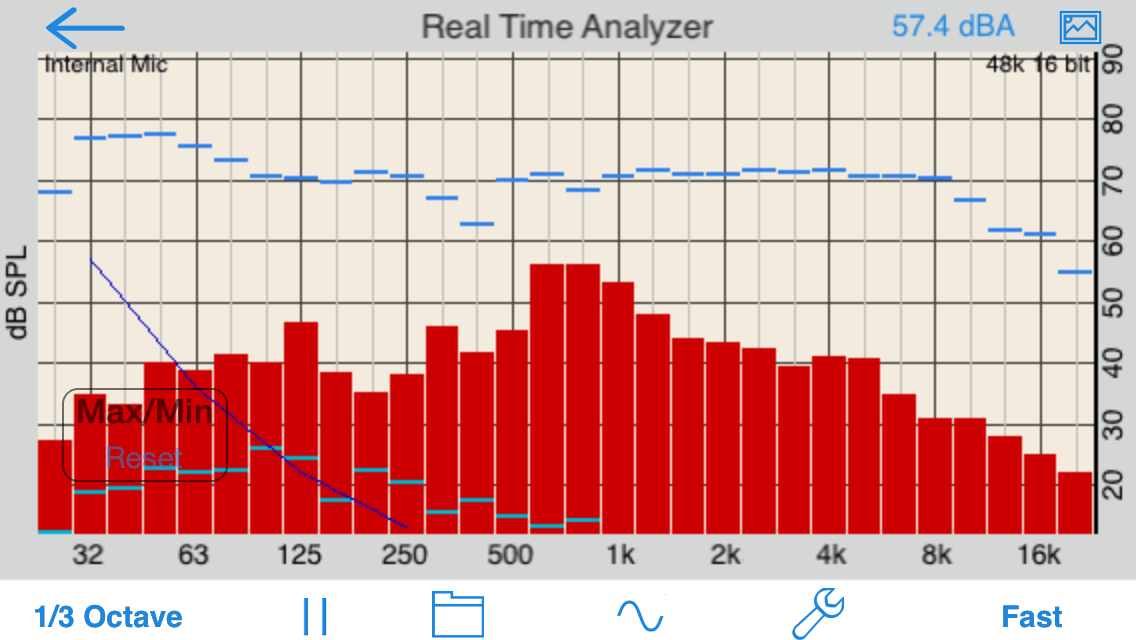
The red bars show the amplitude of each frequency. The blue bars indicate maximum levels reach while the app was running.


1 Reply
Trackback • Comments RSS
Sites That Link to this Post